The U.S. Census Changed How it Defines Urban Areas
Over a Thousand Urban Areas From 2010 Are Now Considered Rural
I recently saw this tweet from the U.S. Census Bureau:
NEW: The nation’s urban population increased by 6.4% between 2010 and 2020 based on #2020Census data and a change in the way urban areas are defined.
— U.S. Census Bureau (@uscensusbureau) December 29, 2022
As a result of the change, 1,140 areas classified as urban in 2010 are now rural.
Learn more: https://t.co/xskx2yR6Vp pic.twitter.com/jqPGyxm1ck
I remember reading public comments in response to the OMB proposal to potentially change its definition of metropolitan and non-metropolitan statistical areas, but I somehow completely missed the conversation around redefining urban areas!
Before diving into any maps or commentary, I should be clear that, in comparison with the OMB’s delineation of core-based statistical areas, the Census Bureau’s definition of urban is far less relevant for local policymakers. Consider this public comment from a planner in Rapid City, anticipating that the OMB’s proposed change could potentially “result in funding shortfalls related to numerous federal funding programs that use this designation as a requirement for eligibility.” In contrast, while the OMB uses metropolitan/non-metropolitan as a significant administrative unit (with non-trivial sums of money at stake), the Census definition of urban and rural is — with a few exceptions — largely a means to accurately describe the country’s population.
That said, I think the urban/rural classification is still important. I’m usually not the biggest fan of changing definitional criteria over time. I like consistency: if a town enters into (or drops out of) the “urban” category, I prefer that it be due to changes within the town rather than changes to the rules. However, the “rules” of economic geography can and do change over time, and our criteria for classifying the observed universe must change along with them.
In the past, remote places, though small, could mirror their larger metropolitan counterparts in terms of density and relative productivity. Rural agglomerations provided labor, housing, commerce, and civic/social activity all in one place — a necessary arrangement due to transportation costs and pre-automobile settlement patterns. However, the past century brought with it a substantial shift in the way we interact with out towns (see my downtown revitalization paper for a good historical overview) and the way the wider economy interacts with its geographic hinterland.
![]() McDowell Street in Welch, West Virginia in 1946 and 2015
McDowell Street in Welch, West Virginia in 1946 and 2015
The “non-metropolitan urbanized town” still exists in 2022, but there are just a whole lot fewer of them than there used to be. The Census Bureau’s new guidelines simply reduce the number of false positives: places that look dense but no longer behave like an urban area. Places like Welch, WV.
The new changes are summarized as follows:
- We increased the minimum population threshold to qualify as urban from 2,500 to 5,000, and we added an alternative: instead of qualifying based on population size, areas can now qualify based on a minimum housing unit threshold.
- We now use housing unit density instead of population density.
- We no longer distinguish between different types of urban areas.
Cutting to the Chase: Some Maps
I could continue rambling about the pros and cons of a big change like this, but I think it’s more helpful to show how this set of changes changes the landscape of rural and urban areas on the map.
The following animation shows all of the urban areas (both the smaller “urban clusters” and larger “urbanized areas”) delineated by the Census Bureau in 2010 and 2020, highlighting the disappearance of more than a thousand areas due to the change in criteria.
The most populated urban areas correspond with the darkest dots on the map, clearly illustrating that the smallest urban areas are the ones dropping out of the sample.
The next maps (and scrollable data table) show how each state fared in the aftermath of the criteria change. In raw terms, Texas lost the most urban areas, but West Virginia and New Jersey lost the highest share of their 2010 urban areas.
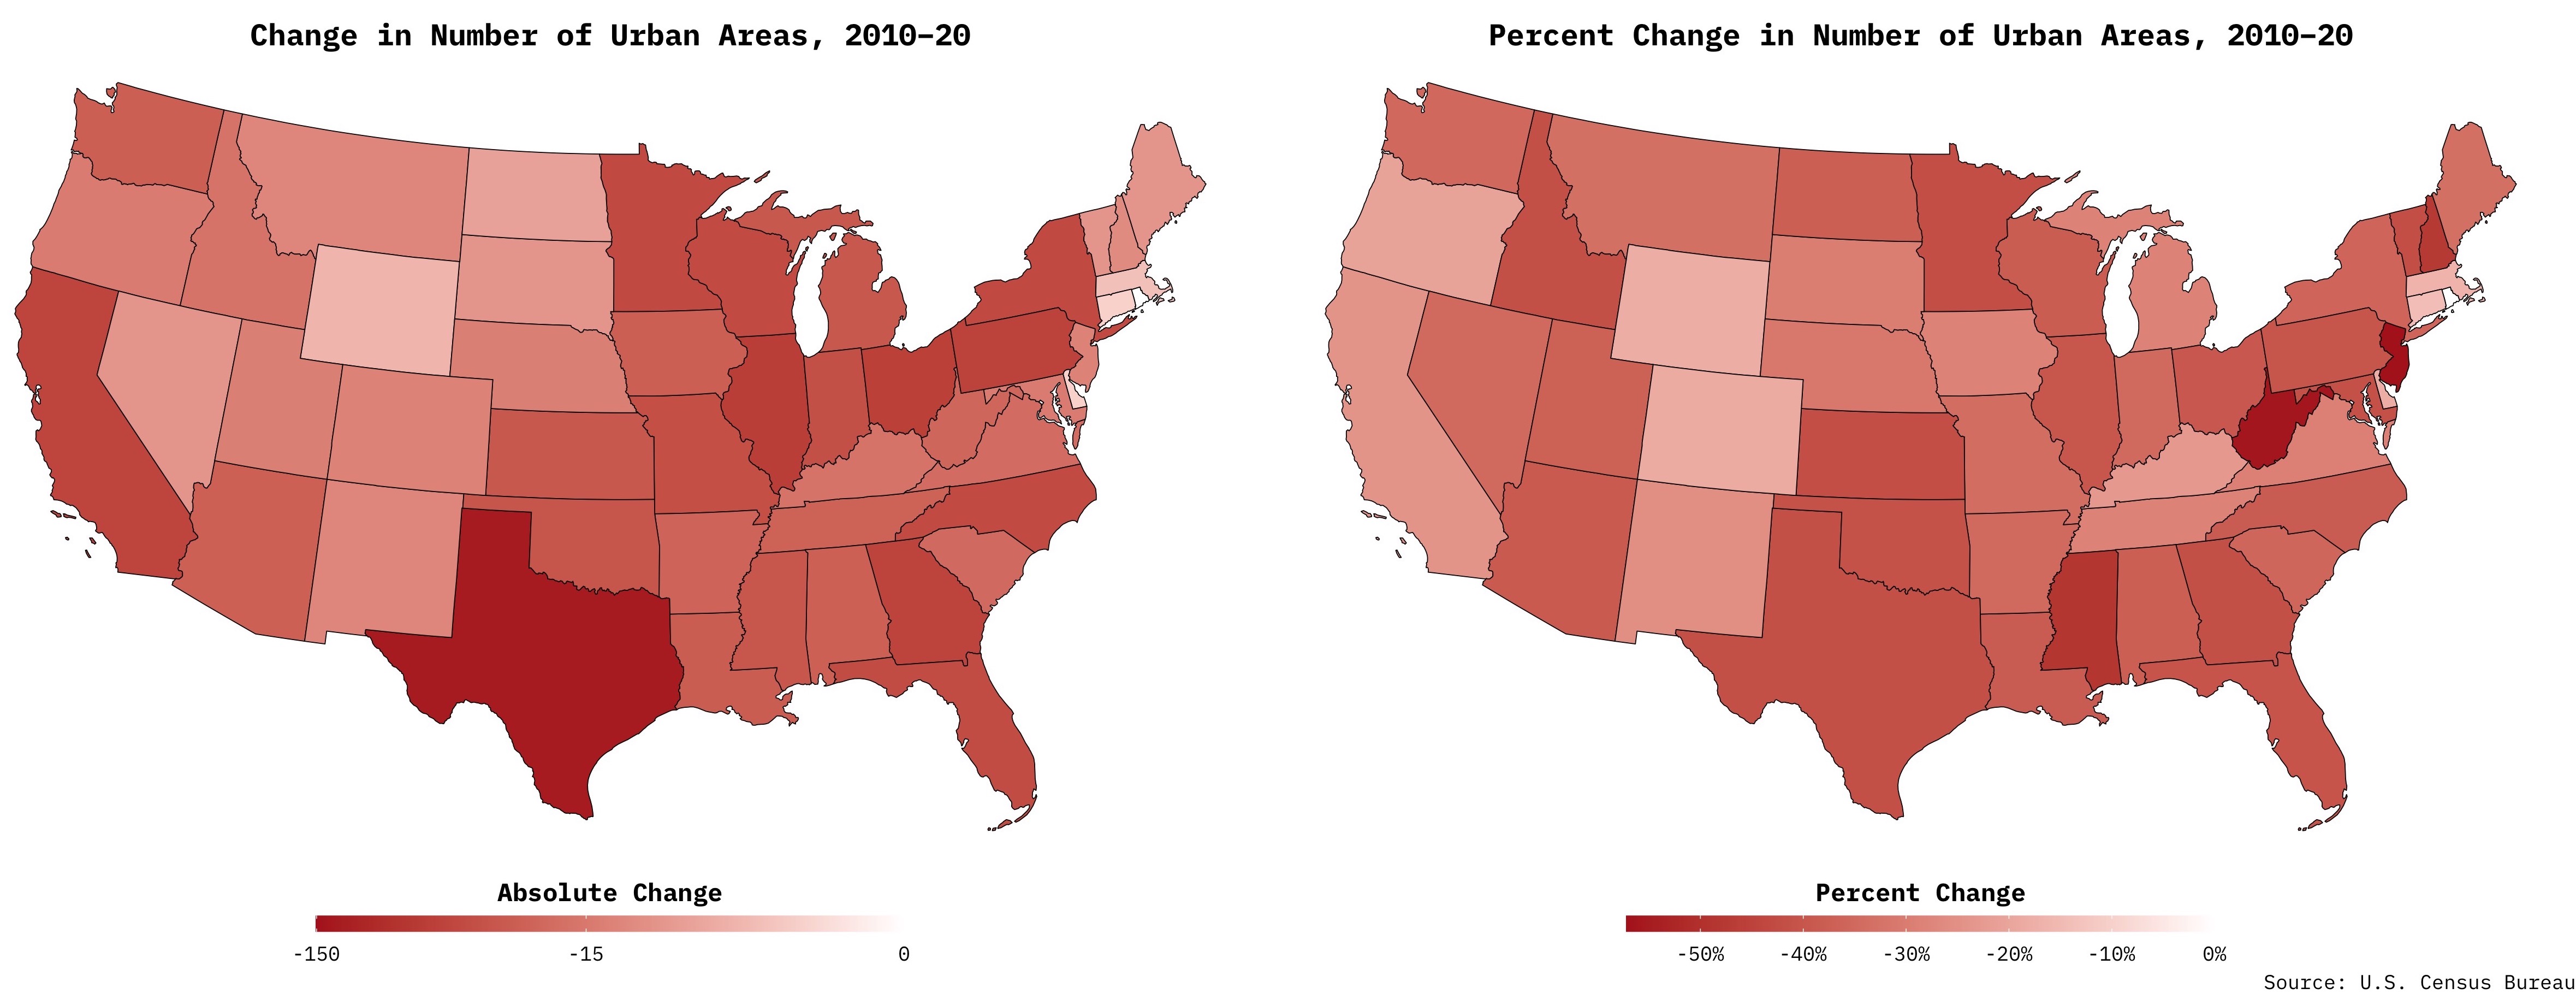 |
|---|
| Note: for all maps, simply click on the image for a larger, high-resolution version. |
A Note for the Cartography Nerds
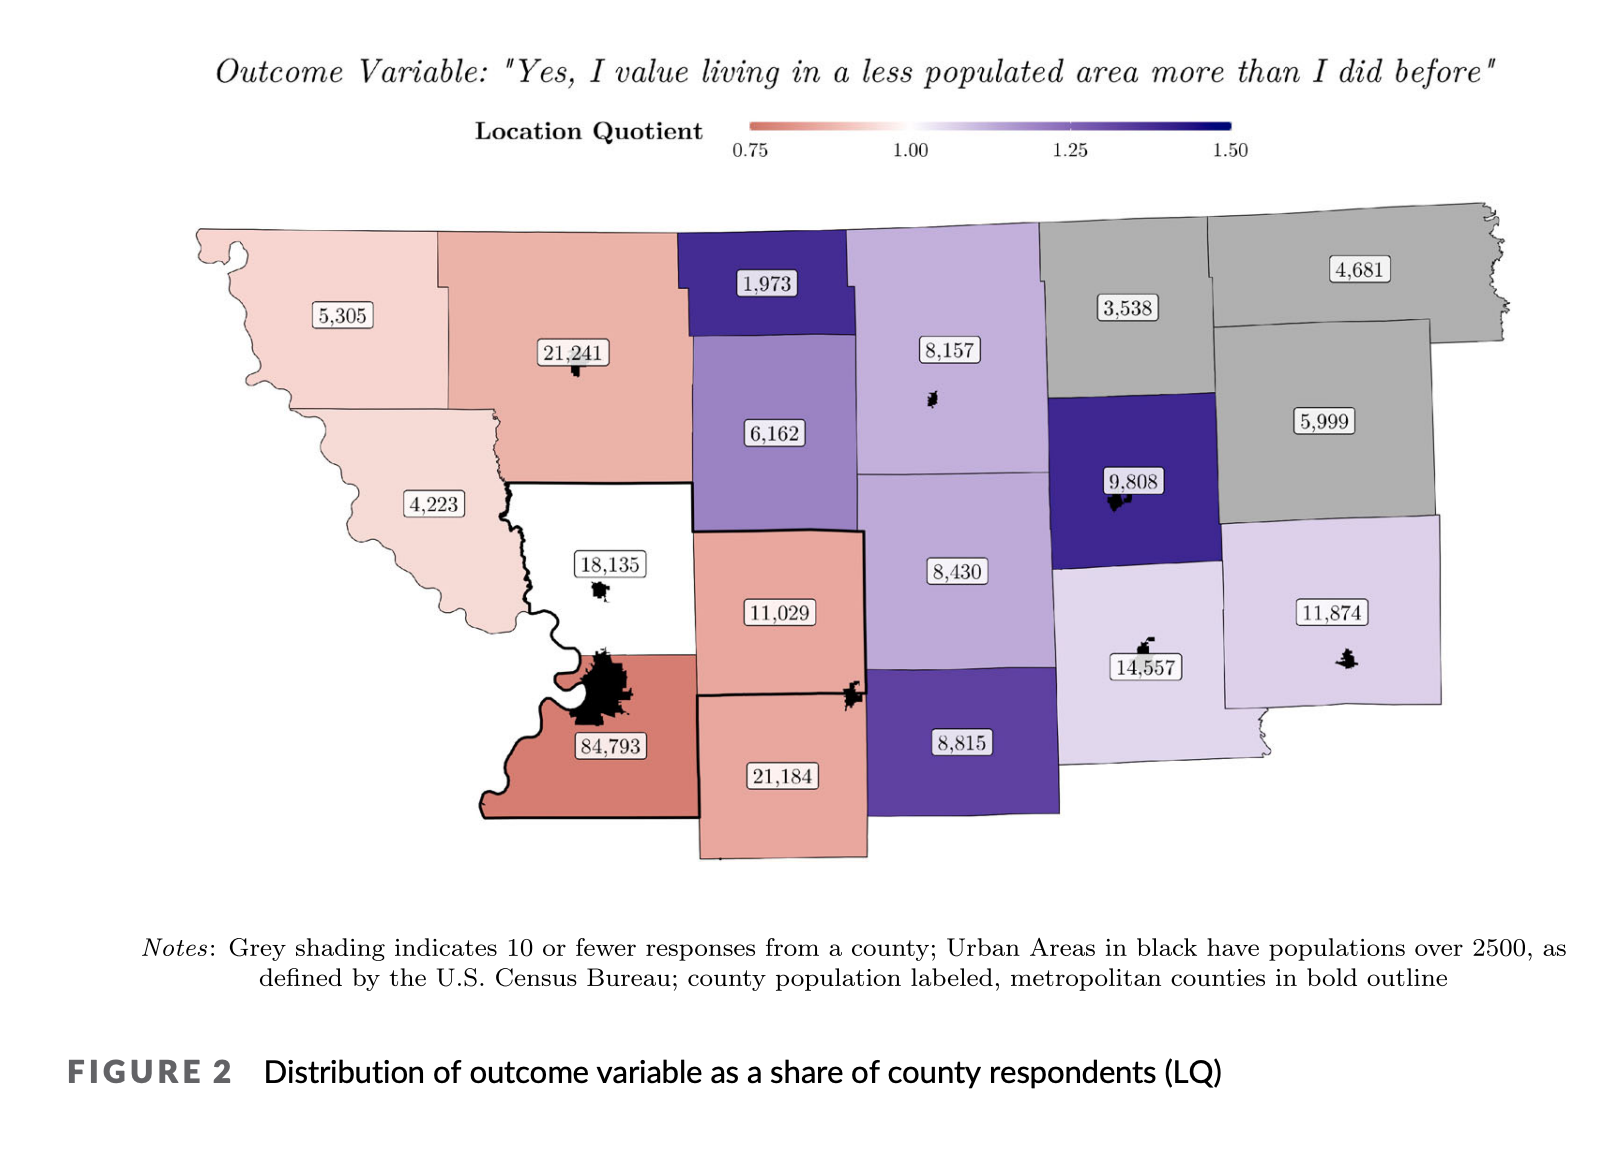
The shapefiles for Census-defined urban areas can be a useful cartographic feature, providing context and orientation to the viewer of a given map. In a recent paper with Sarah Low and Mallory Rahe, we presented a map of the Northwest Missouri region (almost entirely rural) to illustrating the regional variation of a particular survey response. On the map we included a layer with the silhouettes of the urban areas in the region, allowing the viewer to distinguish between counties with a densely populated center and those without.
After creating a similar map for my home state of Oklahoma, it is staggering to see how many urban areas fall of the map (pun intended) after this change in classification criteria. As stated above, I mostly agree with the rationale for and execution of the change. However, I’ll admit that those little red polygons will be sorely missed as a neat little cartographic tool, showing regional population centers, big and small.
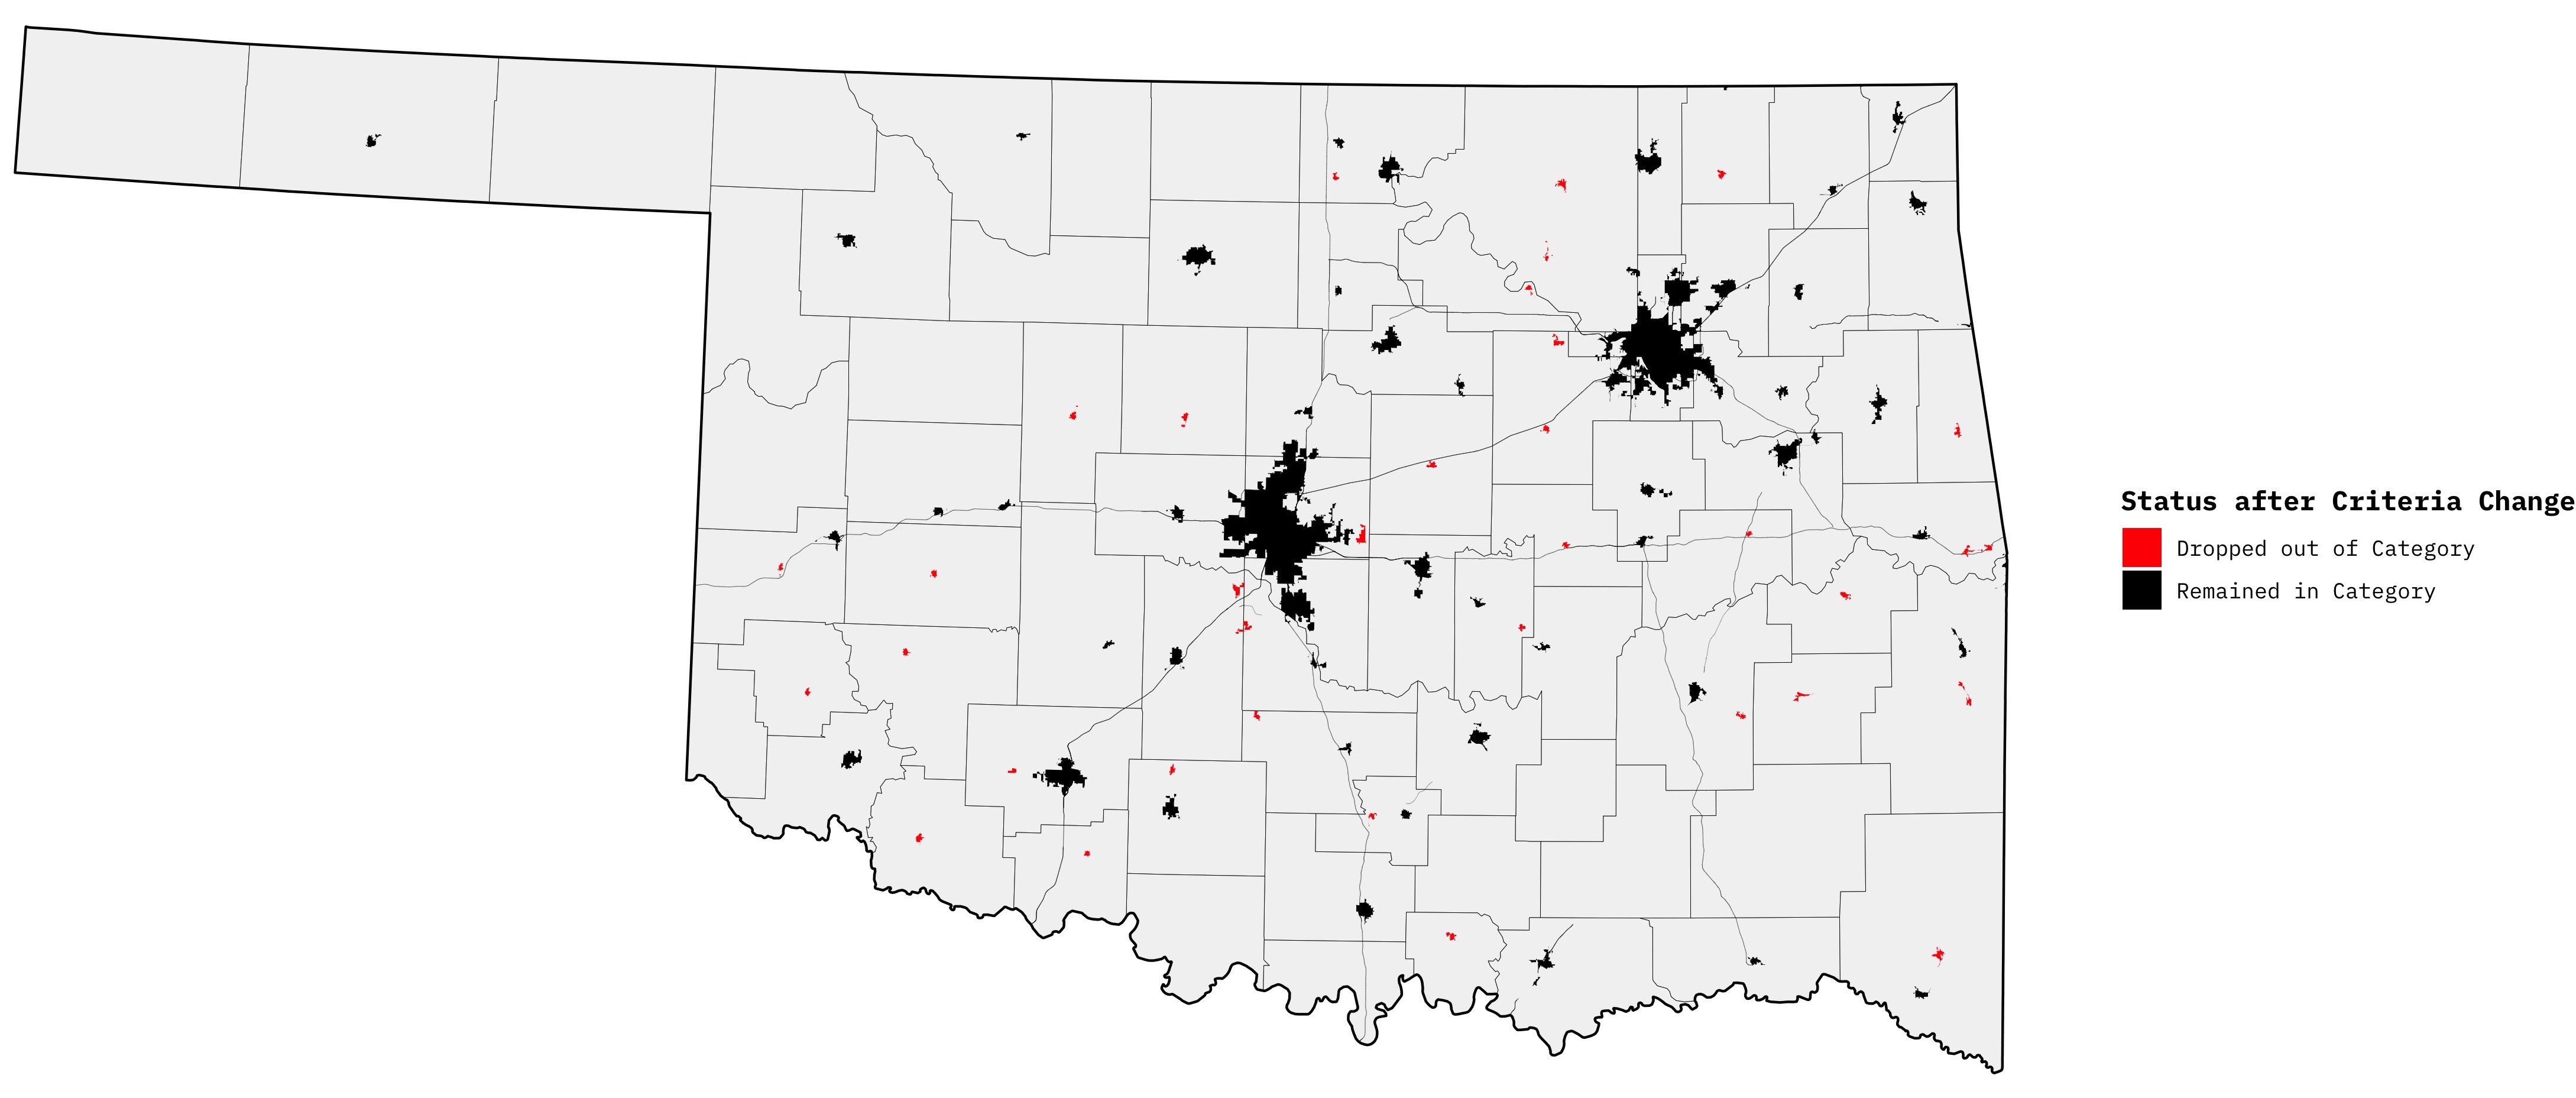 |
|---|
| With the Census Bureau’s new definition of urban, every red polygon in this map is now considered rural. |
As far as workarounds go, I can always a) hold onto the 2010 shapefiles, clutching tightly to “the old ways” or b) come up with my own classification scheme for regional population centers. But where’s the fun in that?